Kim Keating, ZERO TO THREE, Washington, DC

Abstract
This article discusses why and how the State of Babies Yearbook: 2019 was developed; identifies the indicators used to examine the well-being of the nation’s infants and toddlers; and explains how the indicators align with the ZERO TO THREE policy framework areas of Good Health, Strong Families, and Positive Early Learning Experiences. The author describes the methodology used to rank and compare states and summarizes the national findings and variations found among states. The article provides recommendations for using the Yearbook data to inform and promote development of national and state policies that ensure all babies have the opportunity for a strong start.
Decades of research from multiple disciplines demonstrate that the first 3 years of a child’s life are a period of incredible growth and opportunity. From birth to 3 years old, infants and toddlers experience the most rapid physical, cognitive, and emotional development of their lives. By the time they are 3, children acquire the abilities to speak, learn, and reason. During this uniquely sensitive time, young children’s interactions and experiences combine with the influences of genes to shape the architecture of their brains in enduring ways that lay the foundation for lifelong health, well-being, and success. Babies’ brains grow at a faster rate during the first 3 years of life than at any later point in their lifetimes—creating more than 1 million neural connections per second (Thompson, 2001). These connections form the foundational brain architecture on which all later learning and development will rest. Whether this foundation will be strong or fragile is dependent on multiple inputs. Relationships and social interactions, as well as nutrition, safety and protection, provision of basic needs, and regular medical care are all important to how a baby’s brain grows.
The extent to which children are nurtured and supported in their earliest years also has significant and long-lasting societal impacts. Although the social and economic returns of investing in policies that support early development are well-documented in the literature (García, Heckman, Leaf, & Prados, 2016), infants and toddlers are seldom at the forefront of national and state policy agendas. This article explores the State of Babies Yearbook: 2019, a resource designed by ZERO TO THREE in partnership with Child Trends to give policymakers and advocates the information and tools to implement strong policies that support parents and caregivers in nurturing the youngest children and placing them firmly on a path to success in school and in life.1
1Note: Portions of this article have been reproduced from the Yearbook.
About the State of Babies Yearbook: 2019
The State of Babies Yearbook: 2019 is a first-of-its-kind resource that looks holistically at the well-being of the nation’s babies. The aim of this in-depth report is to increase policymakers’ awareness of the unique needs of infants, toddlers, and their families; garner greater support for child- and family-friendly policies and practices; and provide early childhood advocates and policymakers with the information they require to advance federal and state policies that are responsive to babies’ needs. National and state profiles available in the Yearbook provide a snapshot of how babies are faring according to more than 60 indicators in ZERO TO THREE’s policy framework areas: Good Health, Strong Families, and Positive Early Learning Experiences. Key indicators at child, family, and policy levels in each of these domains are reported for all 50 states and the District of Columbia. Understanding the Indicators The indicators included in the Yearbook are objective measures of progress. The criteria used in selecting the indicators include that they are:
- drawn from a reliable, ongoing source that yields data for all 50 states;
- of central importance to the domain, either because they directly measure a component of well-being or are policy choices strongly linked to well-being; and
- readily understood by a broad audience.
The selected set of indicators (see Tables 1–3) address child and family well-being, accessibility and reach of programs and services, and the presence or absence of key policies that promote healthy development. The data were obtained from national datasets (e.g., the Census Bureau’s American Community Survey and National Survey of Children’s Health) that provide reliable, ongoing (available annually), and comparable data for all 50 states and the District of Columbia.
ZERO TO THREE and Child Trends reviewed potential indicators and obtained input from a panel of experts in the field. Panelists also provided feedback on the approach to ranking states. In making the final selection, priority was given to indicators that met the selection criteria described previously; and refinement of the indicators will continue in future editions of the Yearbook as the quality and comparability of data available from states improve.
Table 1. Indicators of Infant and Toddler Well-Being: Good Health
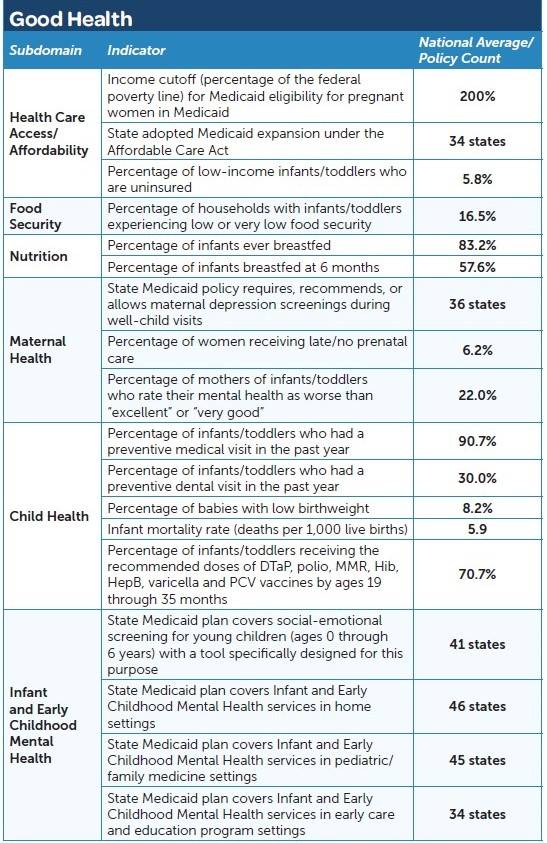
Table 2. Indicators of Infant and Toddler Well-Being: Strong Families
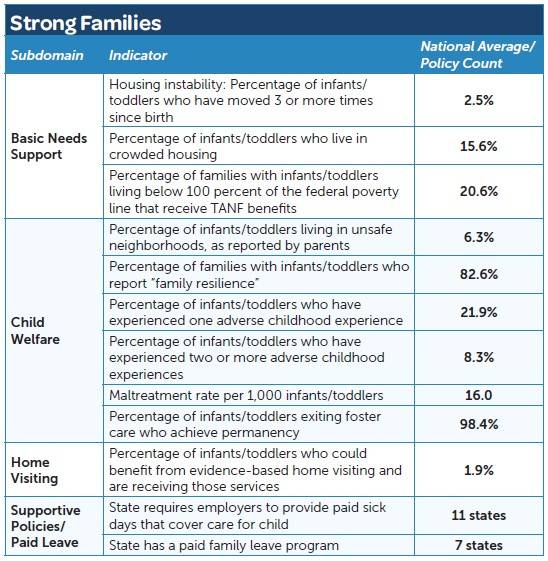
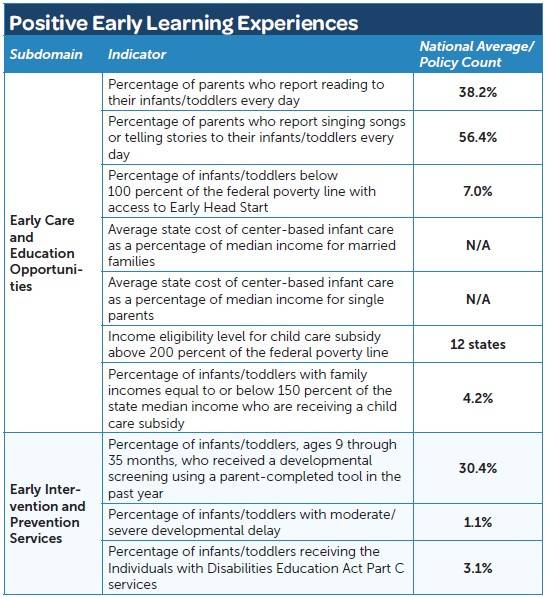
Table 3. Indicators of Infant and Toddler Well-Being: Positive Early Learning Experiences
State Ranking Methodology
The State of Babies Yearbook: 2019 uses a transparent ranking process to group states into one of four tiers to provide a quick snapshot of how states fare on the selected indicators and domains. These tiers represent four groupings that are approximately equal in size in which states are ordered from highest to lowest performing. The tiers are distinguished using the theme of GROW. The tiering symbols are used throughout the Yearbook and on individual State Profiles. These are shown from lowest to highest in Figure 1.
In contrast to individualized state rankings (from 1 to 51), this approach emphasizes that differences between any two states can be relatively minor and/or not statistically significant, and all states have room for improvement. In interpreting a state’s ranking, it is important to recognize that states with higher overall rankings may have some indicators or framework areas that require improvement. Conversely, a state with a lower overall ranking may have promising results for some indicators or framework areas that reflect effective initiatives improving babies’ outcomes.
How States Compare
While all states have room to grow in how they support parents in caring for their young children, some states are more advanced than others in giving babies and their families the chance to overcome adversity and reach their full potential. Figure 2 shows the overall ranking of states based on their results in all three framework areas.
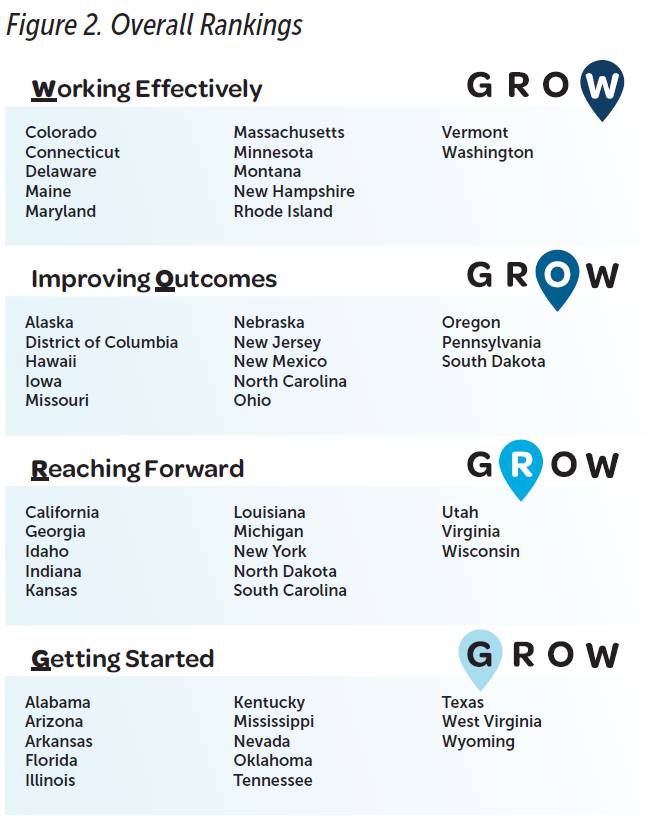
Regional patterns were evident in several areas of the data. Specifically, states in the Northeast and West were more likely to score in the top two tiers of states across all three domains, as compared to states in the Midwest and South. For example, four states in the Northeast (Massachusetts, New Hampshire, Rhode Island, and Vermont) received scores in the highest tier across all three domains. A few states stand out because they received scores in the top tier in one domain, but their scores for the remaining two domains were in the bottom two tiers. For example, New Mexico ranked in the first or top tier (i.e., Working Effectively) for Positive Early Learning Experiences, but in the lower two tiers for Good Health and Strong Families.
Similarly, Delaware received scores in the highest tiers for Positive Early Learning Experiences and Strong Families but scored in the third tier for Good Health. Minnesota and Washington received scores in the highest tiers for Good Health and Strong Families but scored in the third tier for Positive Early Learning Experiences.
What the State of Babies Yearbook Tells Us
National- and state-level findings presented in the Yearbook make clear that the nation’s babies are born into very different circumstances—social and economic—that affect their development. Many infants, toddlers, and families experience substantial challenges, and indicators of their well-being and access to supportive policies vary widely across states. The findings demonstrate how the state in which a baby is born and spends their first 3 years makes a difference in his or her chances for a strong start.
The Nation’s Babies
The nation’s babies reflect the growing diversity of the United States. The current generation of parents, millennials, are the most diverse in our nation’s history. In 2011, for the first time, more than half (50.4%) of the nation’s population under 1 year old were children of color, up from 49.5% the previous year (Frey, 2018). In 2017, 51% of babies were non-white (U.S. Census Bureau, 2018). These changing demographics have substantial implications for planning policies and services that best meet the increasingly diverse familial, cultural, and language needs of the youngest children. Opportunities to grow and flourish are not shared equally by the nation’s infants, toddlers, and families, reflecting past and present systemic barriers to critical resources, such as limited access to quality health care services, stable housing, reliable income and employment, and quality child care (Cosse et al., 2018). Infants and toddlers of color (i.e., black, Hispanic, and Native American) are disproportionately at risk for poorer outcomes in the three domains of well-being. The negative immediate and long-term consequences of early inequities are well documented.
Another powerful indicator of the status of babies in the United States is the country’s standing among other developed nations. The United States ranks 31st for relative child poverty among economically advanced countries (Organisation for Economic Cooperation and Development, 2017). The youngest Americans live in disproportionately low-income and poor families. Research shows that poverty at an early age can be especially harmful, affecting later achievement and employment (Black, Hess, & Berenson-Howard, 2000).
Infants and toddlers represent only 4% of the nation’s population but 6% of those in poverty (U.S. Census Bureau, 2018). As many as 45% of infants and toddlers live in households with incomes less than twice the federal poverty line (about $50,000 a year for a family of four in 2017)—23% are below poverty level—challenging their ability to meet basic needs (Ruggles et al., 2018). Almost 17% of households with infants and toddlers experience low or very low food security (U.S. Census Bureau, 2016).
America’s youngest children are raised in a variety of family contexts that reflect changing characteristics of the society overall. One in 5 babies (21%) lives with a single parent, 9% live in grandparent-headed households, and most (61%) have mothers in the workforce (Flood, King, Rodgers, Ruggles, & Warren, 2018). The changing portrait of the nation’s babies and their families requires policies and services that are responsive to their diverse needs.
Good Health
Good physical and mental health provide the foundation for babies to develop physically, cognitively, emotionally, and socially. The rate of brain growth is faster in the first 3 years than at any later stage of life, and this growth sets the stage for subsequent development. Access to good nutrition and affordable maternal, pediatric, and family health care are essential to ensure that babies receive the nourishment and care they need for a strong start in life.
There are several areas in which infants and toddlers are doing well, and several where the national picture is concerning. States also vary widely on indicators of Good Health, and there are several indicators for which national averages tell only part of the story. For example, noteworthy differences exist in the income eligibility limits states set for pregnant women to participate in Medicaid, with limits ranging from 138% to 380%
of the federal poverty line (FPL). Positive findings include, for example, the number of babies (90.7%) who have received regularly scheduled medical care in the past 12 months. Indicators of serious concern include the following:
- Despite coverage available through Medicaid and the Children’s Health Insurance Program, 5.8% of low-income infants and toddlers lack health insurance.
- As many as 1 in 12 babies (8.2%) is born at low birthweight, which can jeopardize development.
- The national infant mortality rate is 5.9 deaths per 1,000 births (ranging from 3.7 per 1,000 births in New Hampshire to an alarming 9.1 per 1,000 births in Alabama).
- More than 1 in 5 mothers of infants and toddlers (22%) rate their mental health as worse than “excellent” or “very good.” Responsive policies are evident in the Medicaid programs of a majority of states, with 36 states covering screening for maternal depression as part of Early and Periodic Screening, Diagnostic, and Treatment, and 41 states offering social–emotional screening of young children.
Strong Families
Young children develop in the context of their families, where stability and supportive relationships nurture their growth. All families of infants and toddlers benefit from support with parenting, and many—particularly those challenged by economic instability—need access to resources that help them meet their children’s daily and developmental needs. Important supports include home visiting services, child welfare systems that are responsive to young children’s needs, and family-friendly employer policies that provide paid sick and family leave.
- While most indicators in this domain address challenges, an encouraging 4 out of 5 families (82.6% nationally) with an infant or toddler report a favorable level of resilience, with results among states ranging from 63% to 94%. However, infants and toddlers are uniquely sensitive to challenges in their environments, such as the following:
- Nationally, 2.5% of babies experience housing instability (i.e., have moved three or more times since birth).
- A higher proportion, 15.6%, live in crowded housing.
- Infants and toddlers have the highest rates of abuse and neglect of any age group, at 16 per 1,000 for children from birth to 2 years old. Wide differences were found in states’ maltreatment rates, which range from 1.6 per 1,000 infants and toddlers in Pennsylvania to 39.0 per 1,000 in Massachusetts.
- Nationally, on average, 8.3% of infants and toddlers have already been exposed to two or more adverse experiences. While state averages on this indicator range from as low as 2.0% in Massachusetts to 27.3% in Arizona, most states (31) report less than 10% of their babies have had two or more adverse experiences.
- At the policy level, the wide variation in the proportion of families in poverty with a child under 3 years old that receive Temporary Assistance to Needy Families benefits—which ranges from 2.6% in Wyoming to 69.7% in Maryland—suggests this is an area for further exploration.
Positive Early Learning Experiences
Infants and toddlers learn through play, active exploration of their environment, and, most important, through interactions with the significant adults in their lives. Language and literacy skills begin developing at birth and are fostered through sharing books, telling stories, singing songs, and talking to one another. The quality of babies’ early learning experiences at home and in other care settings has a lasting impact on their preparedness for lifelong learning and success. Parents who require child care while they work or attend school need access to affordable,
high-quality care options that promote positive development.
Despite the importance of the early learning that takes place at home, surprisingly few parents report engaging in daily reading or singing with their babies, interactions that are closely related to children’s language development. These low rates of language interaction, particularly for reading, suggest that many parents and other caregivers may not understand that children begin acquiring language skills from birth and that they are not too young to enjoy books with those who nurture them.
- Nationally, only 38.2% of infants and toddlers are read to every day, with state averages ranging from a low of 26% to a high of 59%.
- Parents more frequently talk and sing to their young children (56.4%), with averages ranging from 45% to 69%. Averages were more than 50% in 47 states.
- The extent to which states support families in accessing and affording early care and learning opportunities varies significantly by state. Child care costs can take more than one third of the paycheck of a single parent in some states. Despite the high cost of infant care, few families receive financial assistance for it.
- Only 12 states allow child care subsidies for families with incomes above 200% of the FPL—approximately $50,000 for a family of four—and only 4.2% of infants and toddlers in low- or moderate-income families that feel the pinch of the high cost of care receive subsidies.
- Infants and toddlers in families with incomes below the FPL are eligible for Early Head Start, which provides comprehensive services that promote positive child development. However, as few as 7% of eligible infants and toddlers have access to these services. Access varies widely across states, ranging from a low of 3% in Tennessee to 21% in Vermont.
- Early intervention efforts also differ across states, despite the rapid growth of babies in the first 3 years.
- Nationally, only 30% of infants and toddlers received a developmental screening in the past year. The percentage of infants and toddlers 9 through 35 months old who received a developmental screening ranged from a low of 17.2% in Mississippi to as many as 58.8% in Oregon. Only 11 states had rates above 40%.
- Parents of approximately 1% of children reported their child had been identified with developmental delays, and 3.1% received early intervention services.
Putting the State of Babies Yearbook Data to Work
To take effective action, advocates, program administrators, and legislators require basic information about the infants and toddlers in their state, starting with the size of this population, where infants and toddlers are being cared for, and the economic circumstances of their families. Assessing current policies and practices is also important to inform new policy decisions.
The State of Babies Yearbook: 2019 is a tool to help advocates and policymakers achieve the following goals:
1. “Tell the story” of infants and toddlers in their states and nationally.
2. Compare their state’s progress for infants and toddlers with that of other states, using a common set of indicators.
3. Identify indicators on which babies and toddlers are lagging, so that states can work on responsive policy.
4. Use annual updates to monitor trends in the experiences of infants, toddlers, and their families, and track progress in the states’ policies.
State policymakers and advocates can use the data to understand where their youngest children are doing well, and where they face challenges. Improving outcomes for young children can be achieved by building on the strengths of existing practices and taking innovative steps where the data indicate challenges still exist. For examples of short-and long-term applications see Box 1.
Box
Short-term:
- Communicate: Use indicator data and state rankings to communicate how a state compares to the nation and other states.
- Identify challenges: Use indicator data to identify opportunities where potentially easy interventions could produce measurable and compelling results.
- Strengthen support for current initiatives: Use state profile information to bolster the rationale for programmatic, policy, and legislative changes.
Long-term:
- Track progress: Monitor changes to key indicators, and track policy wins with annual updates of the State of Babies Yearbook.
- Improve data collection: Identify missing indicators. We know that not all important measures of infant and toddler well-being are included
in the Yearbook. In some cases, their absence reflects the fact that current data collection systems do not provide the consistent state-level information required for the State of Babies Yearbook: 2019; in other cases, valid measurement strategies have yet to be identified. Policymakers and advocates can work together to strengthen the country’s data infrastructure concerning infants and toddlers. - Collaborate: Use information about the progress being made in the states to foster sharing of information among states, create opportunities to learn from one other’s experiences (challenges and successes), and develop ongoing connections. States are often incubators for innovative ideas. Their experiences can show others which policy strategies are effective, and which are not.
State of Babies and Think Babies resources available through the ZERO TO THREE Policy Center, such as State of Babies Yearbook: 2019 Toolkit; Promising Approaches at Work in States, the companion brief to the State of Babies Yearbook; and A Place to Get Started: Innovation in State Infant and Toddler Policies, describe strategies that policymakers can consider as they determine how to begin developing infant–toddler policies and include examples of states currently implementing such strategies.
Conclusions and Future Directions
For the early childhood field, this is an exciting time of policy innovation. The importance of children’s earliest years of life has gained more attention than ever before. Across states, this new awareness is translating into creative policy strategies that seek to address the needs of children prenatally to 3 years old. The key to further success, especially for states where challenges across all the domains seem daunting, is to find a manageable place to begin and to be thoughtful about how policy choices fit within a broader system of supports for infants, toddlers, and
their families.
Learn More
State of Babies Yearbook: 2019 Website
http://stateofbabies.org
Visit the website to learn more about the State of Babies, download a full copy of the Yearbook, view and download State Profiles, obtain a copy of the companion brief, Promising Approaches at Work in States, and access advocacy guidance in the State of Babies Yearbook: 2019 Toolkit.
State of Babies Yearbook: 2019 Toolkit
https://stateofbabies.org/take-action
Resources provided in the Toolkit, (e.g., talking points, sample social media posts, templates for letters and articles, and graphics) are designed to help advocates use the State of Babies Yearbook: 2019 to call on their federal and state policymakers to Think Babies and work to improve outcomes for babies and families. The resources can be modified to use with federal, state, and local policymakers.
Promising Approaches at Work in States
https://stateofbabies.org/wp-content/uploads/2019/02/PromisingApproachesinStates.pdf
This companion brief to the State of Babies Yearbook: 2019 highlights a variety of states for their initiatives that address the challenges they face in ensuring infants and toddlers have the greatest opportunity to thrive.
State Self-Assessment Tool
https://www.zerotothree.org/wp-content/uploads/2022/08/Infants-And-Toddlers-In-The-Policy-Picture_-A-Self-Assessment-Toolkit-For-States.pdf
This online tool helps state policy leaders and advocates assess the current status of services for infants, toddlers, and their families, and to set priorities for improving policies, funding, and systems. It is organized by the same goal areas as State of Babies and includes a family survey (available in English and Spanish).
Acknowledgments
The State of Babies Yearbook is an initiative of Think Babies, ZERO TO THREE’s campaign to make babies’ potential our national priority. We are grateful for the support of our funding partners, the Robert Wood Johnson Foundation, which supports the Think Babies campaign’s public education aspects, and the Perigee Fund, which supports the campaign’s public education and advocacy aspects.
About the Author
Kim Keating, MEd, is a senior policy research analyst in the ZERO TO THREE Policy Center. Since joining ZERO TO THREE in 2018, she has been responsible for development of the State of Babies Yearbook: 2019 in partnership with Child Trends. Prior to joining ZERO TO THREE, Ms. Keating worked at James Bell Associates, where she conducted evaluation of child welfare programs and provided evaluation training and technical assistance to a diverse set of Administration for Children and Families’ grantees over the course of 13 years. Her previous experience includes working at Xtria/Ellsworth Associates where she conducted research in support of the Office of Head Start and served for 10 years as project manager of the annual Program Information Report data collection. In this capacity, she provided summary reporting to federal office staff and supported Head Start and Early Head Start programs through ongoing training and technical assistance. She also served as project manager or senior research analyst on numerous Head Start studies, including the first cohort of the Family and Child Experiences (FACES) study for which she conducted child assessments, classroom observations, and interviews with parents and program staff. Ms. Keating holds a master’s degree
in counseling and human development with specialization in infant/toddler mental health from George Mason University and a bachelor’s degree in psychology from the University of Virginia.
Suggested Citation
Keating, K. (2019). Examining the well-being of America’s babies: The State of Babies Yearbook: 2019. ZERO TO THREE Journal, 39(5), 58–64.
References
Black, M. M., Hess, C., & Berenson-Howard, J. (2000). Toddlers from low-income families have below normal mental, motor, and behavior scores on the revised Bayley scales. Journal of Applied Developmental Psychology, 21, 655–666.
Cosse, R., Schmit, S., Ullrich, R., Cole, P. Colvard, J., & Keating, K. (2018). Building strong foundations: Racial inequity in policies that impact infants, toddlers, and families. Washington, DC: Center for Law and Social Policy and ZERO TO THREE. Source link.
Flood, S., King, M., Rodgers, R., Ruggles, S., & Warren, J. R. (2018). Current Population Survey 2017. Integrated Public Use Microdata Series, Current Population Survey: Version 6.0 [dataset]. Minneapolis, MN: IPUMS. doi.org/10.18128/D030.V6.0
Garcia, J. L., Heckman, J. J., Leaf, D. E., & Prados, M. J. (2016). The life-cycle benefits of an influential early childhood program. HCEO Working Paper Series. University of Chicago.
Frey, W. H. (2018). The millennial generation: A demographic bridge to America’s diverse future. [Presentation]. Washington, DC: Brookings Institution.
Organisation for Economic Cooperation and Development. (2017). (Poverty rate indicator). OECD Social and Welfare Statistics: Income distribution. https://data.oecd.org/inequality/poverty-rate.htm
Ruggles, S., Flood, S., Goeken, R., Grover, J., Meyer, E., Pacas, J., & Sobek, M. (2018). American Community Survey 2016, one-year estimates. IPUMS USA: Version 8.0 [dataset]. Minneapolis, MN: IPUMS. https://doi. org/10.18128/D010.V8.0
Thompson, R. A. (2001). Development in the first years of life. The Future of Children, 11(1), 20–33.
U.S. Census Bureau. (2016). Current Population Survey, food security supplement. www2.census.gov/programs-surveys/cps/techdocs/
cpsdec16.pdf
U.S. Census Bureau, Population Division. (2018). Annual state resident population estimates for 6 race groups (5 race alone groups and two or
more races) by age, sex, and Hispanic origin: April 1, 2010 to July 1, 2017. www.census.gov/programs-surveys/popest/data/tables.html

